Effects
Filter Curve EQ
Shape the frequency response by drawing a curve on a frequency-against-gain graph.
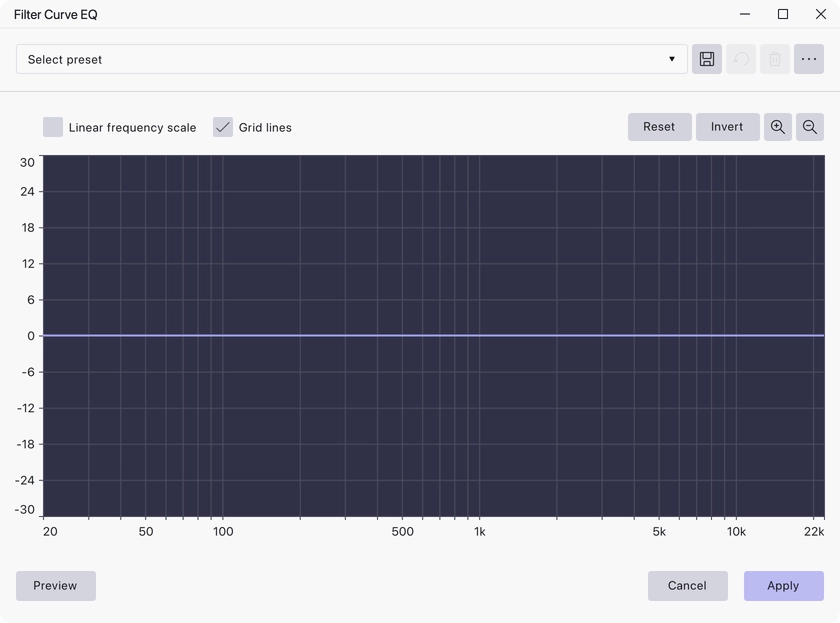
Filter Curve EQ gives you a graph with frequency along the bottom and gain up the side, and a curve you drag into whatever shape you need. Unlike a fixed set of bands, you decide where the control points sit, so you can put a narrow correction exactly where the problem is.
Where to find it
Effect → EQ and filters → Filter Curve EQ, with audio selected.
Controls
The graph itself is the main control. Drag a point to move it, click on the curve to add a point, and drag a point away to remove it. A tooltip follows the point you are moving and shows its frequency and gain.
Above the graph:
- Linear frequency scale — spread the frequency axis evenly instead of logarithmically. Off by default, which puts more of the graph where most musical content lives.
- Grid lines — draw grid lines across the plot.
- Reset — return the curve to flat.
- Invert — flip the curve about the 0 dB line, turning every boost into a matching cut and vice versa.
- Zoom in and Zoom out — narrow or widen the gain range the graph covers, so small adjustments are easier to make or large ones stay on screen.
Notes
Invert is the quick way to undo a correction you applied to one track and apply the opposite to another, or to check what a curve is actually doing by hearing only what it removes.
Zooming changes only the vertical scale of the display; it does not alter the curve or the audio.
Last updated