Effects
Graphic EQ
Shape the frequency response with a bank of fixed one-third-octave faders.
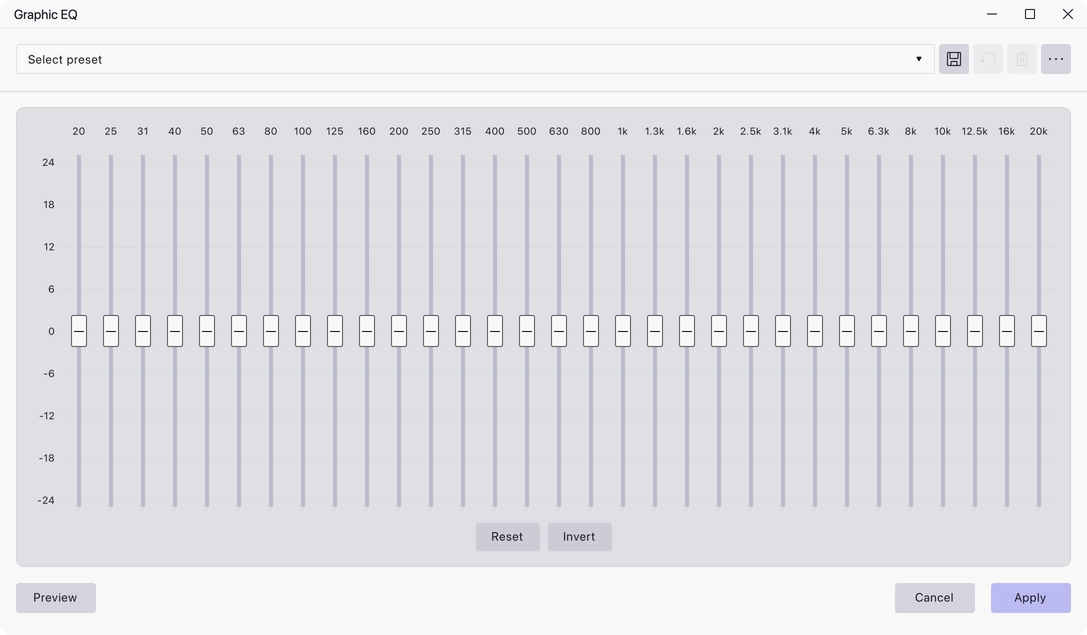
Graphic EQ lays the audible spectrum out as a row of faders, one per one-third-octave band, and you push each one up or down. The bands are fixed, so it is less precise than drawing a curve, but it is faster to work with and easy to read at a glance.
Where to find it
Effect → EQ and filters → Graphic EQ, with audio selected.
Controls
- Band faders — one fader per band, each boosting or cutting that part of the spectrum. The bands are the standard one-third-octave centre frequencies from 20 Hz to 20 kHz: 20, 25, 31, 40, 50, 63, 80, 100, 125, 160, 200, 250, 315, 400, 500, 630, 800, 1000, 1250, 1600, 2000, 2500, 3150, 4000, 5000, 6300, 8000, 10000, 12500, 16000 and 20000 Hz.
- Reset — return every fader to flat.
- Invert — flip every fader about the 0 dB line, turning each boost into a matching cut and vice versa.
Notes
Only the bands that fall below the project’s upper frequency limit are in use, so a project at a lower sample rate offers fewer of the top bands.
If you need a correction that does not line up with one of the fixed bands, use Filter Curve EQ instead — it lets you put a control point at any frequency.
Last updated