Tracks
The waveform
What the waveform display draws — the peak envelope, the zero line, the RMS band, clipping, and the vertical scale.
The waveform is the default way an audio track draws its audio: level plotted against time, running left to right along the timeline. It is the view most editing is done in, because it shows at a glance where the sound is and where it is not.
What it shows
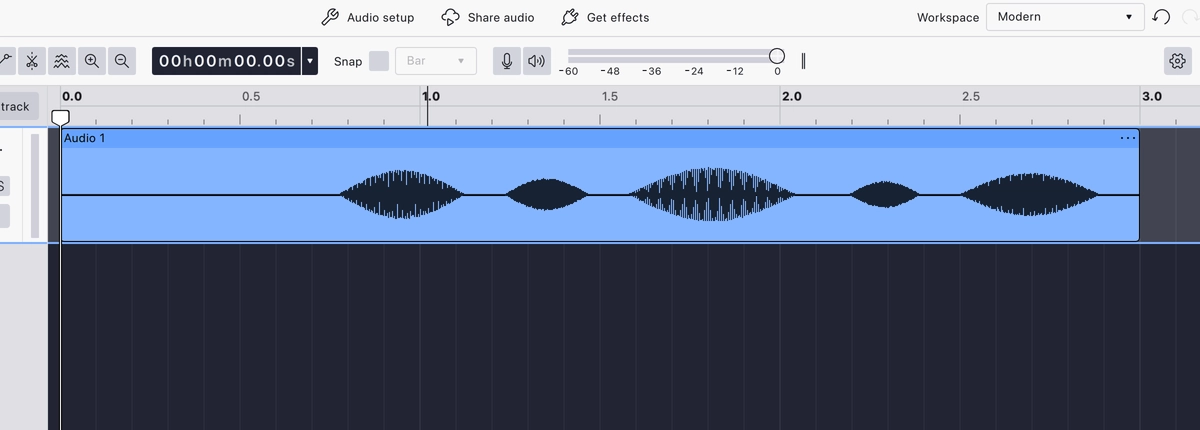
Time runs horizontally, following the timeline. Level runs vertically, with silence in the middle of the track and louder audio reaching further towards the top and bottom edges.
The display is not a picture of every sample. At normal zoom levels each column of pixels stands for a slice of time, and Audacity draws the loudest and quietest sample values in that slice as a single vertical bar. The shape formed by all those bars together is the peak envelope — the outer outline of the waveform, and what you are reading when you judge where a word starts or where a drum hit falls.
Zoom in far enough and the columns stop covering more than one sample, at which point the individual samples themselves are drawn.
The zero line
A thin line runs across the middle of every waveform. That is zero — no signal. The waveform is drawn symmetrically about it, above for positive sample values and below for negative ones, so a silent stretch collapses to the line itself.
A recording whose waveform sits visibly above or below the line, rather than being centred on it, has a DC offset. It wastes headroom and can cause clicks at clip boundaries. Normalize removes it, and does so by default.
The RMS band
RMS (root mean square) is a measure of average level over a short window, and it tracks perceived loudness far better than peaks do. With View → Show RMS in waveform switched on, Audacity draws it as a second, lighter band inside the peak envelope: the darker outer shape is the peaks, the lighter inner shape is the average.
The gap between the two is worth reading. A wide gap — a tall envelope with a thin RMS band inside it — means occasional peaks over a quiet average, which is typical of speech and of untreated drums. A narrow gap means a signal that stays near its peak level, which is what heavily compressed material looks like.
The option is off by default, and applies to the whole application rather than to one project.
Clipping
Clipping is audio that has reached or passed full scale, where the samples have nowhere left to go and the shape of the waveform has been flattened off. It cannot be repaired after the fact — the information is simply not there — so the display exists to help you catch it early.
With View → Show clipping in waveform switched on, any column of the waveform that contains a sample at full scale is drawn as a full-height bar in a contrasting colour, running the whole height of the track. A single clipped sample shows as a thin line; a badly overdriven passage shows as a solid block.
Like the RMS option, it is off by default and applies application-wide. Turning it on changes only how the waveform is drawn — the audio itself is untouched.
The vertical scale
By default the vertical scale is linear amplitude, running from +1.0 at the top of the track through 0 in the middle to −1.0 at the bottom. Full scale is 1.0, which is where clipping is measured against.
The scale itself is not drawn until you ask for it. View → Show vertical rulers turns on a column of per-track rulers down the right-hand edge of the tracks area. Clicking a waveform ruler opens options for that track: vertical zoom in, out and reset, a choice of Logarithmic (dB), Linear (dB) or Linear (amp) for the ruler format, and a Half wave toggle that draws only one side of the centre line. See Vertical Rulers.
Vertical zoom changes how tall the waveform is drawn, not how loud it is. A quiet recording zoomed in vertically fills the track without any of its audio changing.
Related views
The waveform is one of three ways a track can draw itself, chosen from Track visualization in the track’s menu — the others are a spectrogram, and a multi-view that stacks both. Half-wave is a separate toggle that can be combined with any of them. See Track visualization, or Toggle Spectral View for the toolbar button that switches to the spectrogram.
A clip may also carry a volume envelope drawn over its waveform, added with the clip envelope tool. That is a control curve rather than part of the audio’s own shape.
Last updated